Waist-to-hip ratio and BMI measure different things. BMI compares weight to height and says nothing about where that weight sits on the body. Waist-to-hip ratio compares waist and hip circumference and reflects fat distribution instead — research generally finds it a stronger predictor of cardiovascular risk than BMI alone, though neither measurement replaces the other.
What Waist-to-Hip Ratio Actually Measures
Waist-to-hip ratio (WHR) is exactly what it sounds like: your waist circumference divided by your hip circumference. A waist of 80cm and hips of 100cm gives a WHR of 0.80. Because it’s a ratio rather than a raw measurement, it doesn’t need your height or weight at all — only the two circumferences.
What that ratio approximates is where your body tends to store fat. A higher number means more fat carried around the waist and abdomen relative to the hips, often described informally as an “apple” shape. A lower number means more fat carried around the hips and thighs relative to the waist, informally a “pear” shape. This distinction matters because abdominal fat — sometimes called visceral fat, since it surrounds internal organs rather than sitting just under the skin — behaves differently in the body than fat stored elsewhere, and is more consistently linked to cardiometabolic risk in research.
A ratio also has one practical advantage over a raw circumference alone: it’s naturally comparable across people of very different builds. A 90cm waist means something different on a small-framed person than a large-framed one, but expressing that same waist size relative to a person’s own hip size travels better across a population than a single absolute number does — the same reason BMI uses a ratio of weight to height rather than weight alone.
None of this is as precise as a clinical body-composition scan. A DXA (dual-energy X-ray absorptiometry) scan measures fat mass and its distribution directly, and it’s the kind of benchmark researchers use to validate simpler measurements like this one — but it requires specialized equipment and isn’t something most people can access on a routine basis, which is exactly the gap a tape-measure ratio is trying to fill.
How to Measure Your Waist and Hips Correctly
Waist-to-hip ratio is only as useful as the two numbers behind it, and both are easy to measure inconsistently without knowing what to watch for.
For the waist: stand relaxed, breathe out normally, and wrap the tape around the narrowest part of your torso — usually just above the navel, not at your pant line, which typically sits lower than your natural waist. Keep the tape snug against the skin without pulling it tight enough to compress that skin, and check that it stays level all the way around, not higher in front than in back.
For the hips: wrap the tape around the widest part of your hips and buttocks, typically a few inches below the waist measurement point. Feet together, relaxed stance, the same snug-not-tight tension as the waist reading.
Take each measurement two or three times and use the average. A single reading can vary by a centimeter or more depending on exactly how the tape sits that time, and that’s enough to shift which side of a threshold you land on.
The WHO Cutoffs, and What Counts as a Healthy Ratio
The threshold used most often in research — including a 2016 study on central obesity and mortality published in Mayo Clinic Proceedings — classes waist-to-hip ratio as elevated at 0.85 or above for women and 0.90 or above for men, tracing back to public-health cutoffs the World Health Organization set out to establish in a dedicated 2011 expert consultation on waist circumference and waist-to-hip ratio.
| Waist-to-hip ratio | Women | Men |
|---|---|---|
| Lower relative risk | Below 0.85 | Below 0.90 |
| Higher relative risk | 0.85 or above | 0.90 or above |
A couple of worked examples: a 76cm waist and 98cm hips gives a WHR of 0.78 — comfortably under the 0.85 threshold for a woman. A 96cm waist and 100cm hips gives a WHR of 0.96 — over the 0.90 threshold for a man.
These are population-screening bands, the same kind BMI uses, not individual diagnoses. Sitting just above the line isn’t a verdict any more than a BMI of 25.1 is — it’s a signal that abdominal fat distribution is a reasonable thing to pay attention to, alongside everything else a full picture of health includes.
WHR vs. BMI: What Each One Sees That the Other Misses
BMI is simple by design: weight divided by height, squared. That simplicity is also its blind spot — it can’t distinguish muscle from fat, and it says nothing about where on the body any given weight is carried. Two people can share an identical BMI and have very different waist-to-hip ratios, and research suggests that difference matters for health risk in ways BMI alone can’t show.
The clearest evidence for this comes from the INTERHEART study, a 2005 case-control study of roughly 27,000 people across 52 countries. It found that waist-to-hip ratio had a strong, graded, and consistent relationship with heart attack risk worldwide, and that BMI’s own weaker association with heart attack risk mostly disappeared once waist-to-hip ratio was factored in. The study’s authors argued for assessing obesity by waist-to-hip ratio rather than BMI on the strength of that finding — though it’s worth noting they weren’t arguing to discard weight as a factor entirely, just to stop treating BMI as the primary one.
A 2016 Mayo Clinic Proceedings study adds a related, more specific piece. Tracking 7,057 adults aged 65 and older with existing coronary artery disease over a median of 7.1 years, it found that people with a normal BMI but an elevated waist-to-hip ratio — carrying central fat despite an unremarkable overall weight — had the highest mortality risk of any group in the study, roughly 29% higher than people with both a normal BMI and a normal waist-to-hip ratio. BMI alone would have filed these people as lower-risk. This pattern is sometimes described informally as “skinny fat,” or more formally as normal-weight obesity — occasionally abbreviated TOFI, short for “thin outside, fat inside” — and it’s a direct illustration of what a single number focused on total weight can miss.
This connects to a broader pattern researchers sometimes call the obesity paradox — cases where BMI-based weight categories don’t line up neatly with outcomes in certain populations. Part of the explanation researchers point to is exactly what this article has been building toward: BMI can’t see whether a given weight is mostly muscle or mostly fat, or where fat is carried, and both of those gaps are what waist-to-hip ratio and similar measurements are trying to close.
Age adds another layer worth knowing about. Muscle mass tends to decline gradually over the years even when weight holds steady, which can let BMI look unchanged while body composition is genuinely shifting — our guide to protein needs in older adults covers that mechanism directly. Waist-to-hip ratio doesn’t fully solve this either, since a shrinking hip measurement from muscle loss can move the ratio for reasons that have nothing to do with new fat gain. No single number, including this one, replaces a fuller picture.
Should You Stop Using BMI?
No — and not because BMI is more accurate than the alternatives, but because it isn’t trying to answer the same question. BMI is a fast, free, equipment-light way to flag population-level weight categories, and it remains useful for exactly that job: tracking a trend over time, or giving a doctor’s visit a quick starting reference point.
What’s worth retiring is the idea that BMI alone is a complete picture. Waist-to-hip ratio, waist-to-height ratio, and newer measurements like Body Roundness Index all exist because BMI structurally can’t see fat distribution or body composition — not because BMI’s arithmetic is wrong. Using BMI alongside one of these, rather than instead of it, is what the research above actually supports.
Where Waist-to-Hip Ratio Fits With What’s Already on This Site
This site’s BMI calculator already covers a related companion measurement: waist-to-height ratio, which divides waist circumference by height, with a commonly used threshold around 0.5. It’s worth being clear about how that differs from waist-to-hip ratio, since the two get confused often.
Waist-to-height ratio needs only your waist and your height, and is generally read against a single threshold. Waist-to-hip ratio needs your waist and your hip circumference instead — no height involved at all — and is read against sex-specific bands rather than one universal cutoff, because typical hip circumference differs meaningfully between men and women in a way height alone doesn’t capture. Both are trying to solve the same underlying problem — BMI’s blindness to fat distribution — from a slightly different angle, and neither is simply an upgrade on the other.
Get your BMI and its existing waist-to-height ratio companion figure from the BMI calculator, using your height and weight. Waist-to-hip ratio itself is simple enough to work out by hand once you have both measurements — waist divided by hip, checked against the table above.
If you’ve already used the waist-to-height ratio section there, waist-to-hip ratio is a reasonable second, independent check, not a replacement for it — the two measurements can occasionally disagree about the same body, which is part of why using more than one adds real information rather than just repeating the same result twice.
Body Roundness Index: The Newer Measurement People Are Also Asking About
Body Roundness Index (BRI) is a newer measurement showing up in searches alongside BMI and waist-to-hip ratio, and it’s a genuine gap in most existing comparison articles. It was introduced in 2013 by researchers who combined height, waist circumference, and hip circumference into a single geometric index of body shape — no bathroom scale required. The goal was a shape-based estimate of total body fat and visceral fat that improved on what waist circumference or BMI could offer on their own.
A larger 2024 study published in JAMA Network Open, using US national health survey data, found that BRI’s relationship with all-cause mortality forms a U-shape rather than a straight line. Compared with people in the middle of the range studied (a BRI of roughly 4.5 to 5.5), people with a BRI below about 3.4 had a 25% higher mortality risk, and people with a BRI of 6.9 or above had a 49% higher risk. Both very low and very high body roundness were linked to worse outcomes than the middle of the distribution — a pattern that doesn’t show up the same way with BMI, where risk relates more like a gradual upward slope above the healthy range.
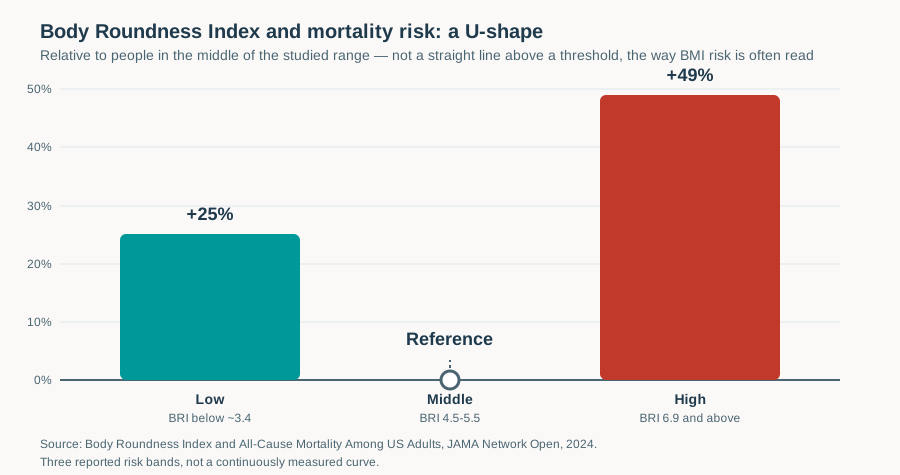
That U-shape is a genuinely useful finding, but it comes with a familiar caution in this kind of population research: very low measurements in observational data sometimes reflect underlying illness or muscle loss rather than a protective effect of leanness itself, which is one reason researchers describe this as an association, not a settled cause-and-effect story in either direction.
BRI is genuinely newer than BMI or waist-to-hip ratio, without decades of clinical familiarity behind it, and there’s no widely agreed simple version to calculate at home the way there is for the other measurements on this page. Treat the research above as an interesting, active area rather than a number to start tracking instead of the others — a research finding, not yet a bathroom-scale-replacing standard.
| Measurement | What it needs | What it estimates |
|---|---|---|
| BMI | Height, weight | Overall size relative to height |
| Waist-to-height ratio | Waist, height | Central fat relative to height |
| Waist-to-hip ratio | Waist, hip | Fat distribution — central versus lower body |
| Body Roundness Index | Height, waist, hip | Overall body shape and estimated visceral fat |
Putting It Together
None of the measurements on this page are a diagnosis, and no single number here should be read as a verdict on its own. BMI, waist-to-height ratio, waist-to-hip ratio, and Body Roundness Index each capture a different, partial view of a genuinely complex picture, and the research covered above generally supports using more than one together rather than picking a single winner.
A reasonable, unhurried way to use all of this: check your BMI on the BMI calculator for a fast baseline, measure your waist and hip using the technique above, and read both against the tables on this page rather than either number alone. If you’re curious how your height-based measurements compare across a few different methods, the ideal weight calculator runs several classic formulas side by side for more context.
If any of these numbers has you thinking seriously about a weight-related goal, the calorie calculator for weight loss is a more useful next step than continuing to compare measurement methods — it turns a goal into an actual daily number and a realistic pace.
Everything on this page is general, population-level information drawn from published research, not a personal diagnosis or medical advice. A single measurement outside these ranges is a reasonable prompt to bring it up with a doctor, especially alongside other risk factors like blood pressure, cholesterol, or family history, rather than a reason to act on a ratio alone.