We generated real, deterministic 7-day meal plans for all 8 of Calorilator’s diet patterns using the site’s own production meal-plan engine — the same code behind the meal-plan tool — then priced every ingredient in each plan’s actual shopping list against 2026 US grocery data. The spread was bigger than expected: a vegan pattern comes in at $46.17 a week, below USDA’s 2026 Thrifty Food Plan reference cost for a single woman, while a high-protein pattern costs $103.56 a week for a nearly identical calorie total. Run across a year at the same 2,000 kcal/day target, that’s a $2,984.28 gap between two diets built from the same 60-ingredient database, priced the same week, for the same one person.
Key Findings
- $46.17/week — a real, engine-generated vegan meal plan (2,000 kcal/day, 7 days, balanced macros) costs less than USDA’s 2026 Thrifty Food Plan reference cost for a single adult woman ($57/week), the lowest-cost of USDA’s four official food plans.
- $2,984.28/year — the gap between the cheapest pattern tested (vegan, $2,400.84/year) and the most expensive (high-protein, $5,385.12/year), for one person eating 2,000 kcal/day, every day.
- 70% more per gram of protein — a high-protein diet’s protein costs $0.0684/g versus vegan’s $0.0402/g, despite the high-protein pattern being explicitly optimized to deliver more of it.
- 15% more expensive for fewer carbs — a low-carb pattern ($97.79/week) costs more than a standard omnivore pattern ($85.17/week) at the same calorie target, because it replaces cheap rice and pasta with more meat, fish, and nuts to close the calorie gap.
- 41–73% of the whole week’s grocery bill goes to just the 3 costliest ingredients in every pattern tested — and salmon or shrimp lands in that top 3 in 7 of the 8 patterns.
Methodology
What was actually run. Calorilator’s production meal-plan generator was executed directly, once per diet pattern, at a fixed 2,000 kcal/day target, 4 meals/day, “moderate” cooking effort, no exclusions or dislikes, with a fixed random seed so results are reproducible. Six patterns (omnivore, vegetarian, vegan, pescatarian, halal, mediterranean) used the engine’s “balanced” macro preset (40% carb / 30% protein / 30% fat); low-carb used its low-carb preset (25/35/40); high-protein used its high-protein preset (35/40/25). Each run returned a real 7-day shopping list drawn from the site’s 60-item, USDA FoodData Central–sourced ingredient database. Across all 8 patterns, 43 unique ingredients needed pricing.
Pricing. Every ingredient was priced against real, dated 2026 US grocery data, tiered by source confidence:
| Tier | Source type | Share of study’s line items |
|---|---|---|
| 1 | BLS Average Price Data (via FRED series) — direct BLS price series for standardized commodities | 8 of 43 items |
| 2 | USDA Economic Research Service reports (Fruit & Vegetable Prices, Food Price Outlook) or comparable dated market reports | 15 of 43 items |
| 3 | National retail-average pricing (Walmart/Kroger/Costco-class 2026 shelf prices) — used only where no BLS series itemizes the product at all | 20 of 43 items |
Tier 3 exists because BLS’s Average Price program covers roughly 40 highly standardized grocery items (ground beef, eggs, milk, white rice, and similar staples) and has no series whatsoever for kale, quinoa, tofu, edamame, walnuts, or fresh berries — a real, structural gap in that dataset, not a shortcut taken here.
Dry-to-cooked conversion. The ingredient database records several items in cooked form (lentils, brown rice, white rice, pasta, quinoa) while grocery prices are for the dry, as-purchased product. Standard culinary yield ratios were applied before pricing: rice 1:3 (dry:cooked), pasta 1:2.3, quinoa 1:3, lentils 1:2.5.
Formula:
Weekly grocery cost = Σ over every shopping-list line:
  (recipe grams × dry-conversion factor ÷ 100) × (price per 100g, as-purchased)
Worked example. The omnivore plan’s real shopping list calls for 400g of whole egg across the week — 8 eggs at 50g each. FRED’s mirror of the BLS eggs series puts eggs at $2.14/dozen for 2026, i.e. $0.1783 per egg. 8 × $0.1783 = $1.43 for that one line item (the full computation carries unrounded intermediate values, so this rounds to $1.42 in the totals below).
Sample & date range. 8 diet patterns × 1 seeded 7-day plan each = 56 person-days of meal planning, 310 total shopping-list line items, 43 unique ingredients, priced against grocery data dated across 2026.
The full limitations of this approach — including the pricing-source gaps above and the single-seed sample — are covered in their own section below.
Full Rankings: Weekly Grocery Cost by Diet Pattern
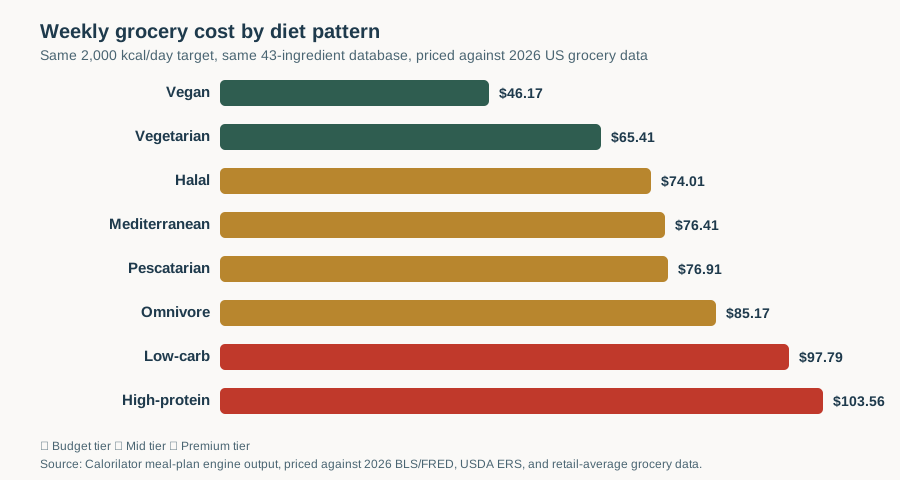
| Rank | Pattern | Weekly Cost | Daily Cost | Annual Cost | $/1000 kcal | $/g Protein | Tier |
|---|---|---|---|---|---|---|---|
| 1 | Vegan | $46.17 | $6.60 | $2,400.84 | $3.074 | $0.0402 | 🟢 Budget |
| 2 | USDA Thrifty Food Plan (woman, 19–50) | $57.00 | $8.14 | $2,964.00 | n/a — USDA plan, no macro breakdown | n/a | 🟢 Budget |
| 3 | Vegetarian | $65.41 | $9.34 | $3,401.32 | $4.419 | $0.0554 | 🟢 Budget |
| 4 | USDA Moderate Food Plan (woman, 19–50) | $68.00 | $9.71 | $3,536.00 | n/a | n/a | 🟡 Mid |
| 5 | USDA Thrifty Food Plan (man, 19–50) | $71.00 | $10.14 | $3,692.00 | n/a | n/a | 🟡 Mid |
| 6 | Halal | $74.01 | $10.57 | $3,848.52 | $5.081 | $0.0612 | 🟡 Mid |
| 7 | Mediterranean | $76.41 | $10.92 | $3,973.32 | $5.279 | $0.0618 | 🟡 Mid |
| 8 | Pescatarian | $76.91 | $10.99 | $3,999.32 | $5.198 | $0.0639 | 🟡 Mid |
| 9 | USDA Moderate Food Plan (man, 19–50) | $83.00 | $11.86 | $4,316.00 | n/a | n/a | 🟡 Mid |
| 10 | Omnivore | $85.17 | $12.17 | $4,428.84 | $5.878 | $0.0692 | 🟡 Mid |
| 11 | Low-Carb | $97.79 | $13.97 | $5,085.08 | $6.766 | $0.0725 | 🔴 Premium |
| 12 | High-Protein | $103.56 | $14.79 | $5,385.12 | $6.943 | $0.0684 | 🔴 Premium |
USDA Thrifty/Moderate Food Plan rows are USDA’s official 2026 reference costs, included as an external benchmark — they weren’t generated by Calorilator’s engine and carry no ingredient-level breakdown here.
Surprising Insights
The vegan pattern, priced against the USDA Thrifty Food Plan
The USDA’s Thrifty Food Plan is the lowest-cost of USDA’s four official food plans for a nutritionally adequate diet, and the reference used to calculate SNAP benefit amounts. Calorilator’s vegan pattern, generated with zero cost-optimization (the engine was never told to minimize price; it was only told to hit calorie and macro targets), came in at $46.17/week — 19% below the Thrifty Plan’s $57/week reference cost for an adult woman, and 35% below its $71/week reference cost for an adult man. The plan wasn’t built as a “budget” diet. It just happened to lean on lentils, tofu, and edamame — three of the cheapest protein sources in the entire database — to hit its protein target, and that was sufficient on its own to price below the Thrifty Plan reference cost. If you want to see what your own protein target actually is before comparing costs, the protein calculator will give you that number in under a minute.
Cost is only one side of the comparison. A 2026 clinical trial on ketogenic, Mediterranean, and plant-forward diets looked at the health-outcome side directly, tracking liver fat and prediabetes remission across a low-carb-style keto arm and a Mediterranean arm like the two patterns priced here, with weight loss matched across all three groups.
Cutting carbs doesn’t cut cost — it raises it
The intuitive assumption is that a low-carb diet, by definition, buys less food. It doesn’t work out that way here. Low-carb costs $97.79/week — 15% more than the standard omnivore pattern’s $85.17/week — at essentially the same calorie total (14,452 kcal vs. 14,489 kcal for the week). The reason is arithmetic, not ideology: rice, pasta, and bread are among the cheapest calorie sources in the database, and a low-carb macro target removes most of them. The calories they would have provided have to come from somewhere else — and the “somewhere else” here is more meat, more fish, and more nuts and oil, all of which cost several times as much per calorie.
Two ingredients quietly run away with the budget
Salmon and shrimp are not the headline ingredient of any of these 8 diet patterns — they’re a rotation item, appearing in a handful of the week’s 28 meals. But they’re disproportionately expensive relative to how often they show up: together they land in the top 3 costliest line items in 7 of the 8 patterns tested, and in the high-protein plan specifically, salmon ($16.85) and shrimp ($14.87) alone account for 30.6% of that week’s entire $103.56 grocery bill — more than the other roughly 35 ingredients on the list combined.
What $75 a Week Buys You, by Diet Pattern
A fixed grocery budget stretches very differently depending which pattern it’s spent on. At a flat $75/week — close to the median across the 8 patterns tested — here’s how many full days of that pattern’s real, macro-complete meal plan it actually covers:
| Pattern | Days of full meal plan per $75/week |
|---|---|
| Vegan | 11.4 days |
| Vegetarian | 8.0 days |
| Halal | 7.1 days |
| Mediterranean | 6.9 days |
| Pescatarian | 6.8 days |
| Omnivore | 6.2 days |
| Low-Carb | 5.4 days |
| High-Protein | 5.1 days |
The same $75 covers more than two full weeks of vegan eating and barely five days of high-protein eating — a 2.2x spread from a single fixed budget.
Limitations
- Prices are national averages, not local ones. Actual grocery costs vary meaningfully by region, store tier (discount vs. premium grocer), and season; a household’s real cost will differ from these figures in either direction.
- Roughly half of each pattern’s dollar total (46–84% depending on the pattern) rests on Tier 3 retail-average pricing rather than a single verified BLS series, because BLS’s Average Price program simply doesn’t itemize most fresh produce, nuts, or plant proteins.
- The BLS and FRED primary source pages could not be independently re-fetched during this research pass — both blocked automated access at the time of writing. Cited series values (ground beef, chicken breast, eggs, rice, dried beans, yogurt) are cross-referenced across multiple independent secondary sources rather than pulled directly from the raw series page; a reader can independently verify each cited series at fred.stlouisfed.org.
- No food waste, bulk discounting, sales, or coupons are modeled. Real households rarely pay full per-unit shelf price for every gram purchased; this study prices exactly what the recipe calls for, at listed price, with zero waste.
- This is one seeded 7-day plan per pattern, not an average across many runs. A different random seed at the same calorie and macro targets would produce a different specific shopping list, and could shift these numbers by some margin — though the underlying cost drivers (protein source, meat vs. legume balance) would likely hold.
- Dry-to-cooked yield ratios are standard culinary conversions (rice 1:3, pasta 1:2.3, quinoa 1:3, lentils 1:2.5), not brand- or product-specific figures; individual products vary somewhat around these averages.
Get the Data
The complete 310-line ingredient-level shopping list and per-item cost breakdown for all 8 diet patterns — the full detail behind the summary numbers above — is available as a downloadable CSV. The methodology section above covers the price-source tiering and dry/cooked conversion factors in full.
Data Appendix
Master Ingredient Price Table (43 items)
| Ingredient | Price basis | Tier | Source |
|---|---|---|---|
| Ground beef 85/15 | $1.506/100g raw | 1 | BLS/FRED, ground beef series, 2026 |
| Chicken breast | $0.922/100g raw | 1 | BLS/FRED, boneless chicken breast series, 2026 |
| Egg | $0.356/100g ($2.14/doz) | 1 | BLS/FRED, eggs series, 2026 |
| White rice | $0.243/100g dry | 1 | BLS/FRED, white rice series, $1.10/lb dry, 2026 |
| Lentils | $0.372/100g dry | 1 | BLS/FRED, dried beans/lentils series, $1.689/lb dry, 2026 |
| Greek yogurt | $0.700/100g | 1 | BLS/FRED, yogurt series, $1.587/8oz, 2026 |
| Mozzarella | $0.679/100g | 2 | Cheese market report, $3.08/lb, 2026 |
| Cottage cheese | $1.102/100g | 2 | Retail average, ~$5/lb tub, 2026 |
| Potato | $0.068/100g | 2 | USDA ERS, $0.31/lb, 2026 |
| Watermelon | $0.071/100g | 2 | USDA ERS, $0.32/lb, 2026 |
| Sweet potato | $0.220/100g | 2 | USDA ERS, ~$1.00/lb, 2026 |
| Tomato | $0.419/100g | 2 | USDA ERS, ~$1.90/lb, 2026 |
| Onion | $0.198/100g | 2 | USDA ERS, ~$0.90/lb, 2026 |
| Carrots | $0.209/100g | 2 | USDA ERS, ~$0.95/lb, 2026 |
| Broccoli | $0.397/100g | 2 | USDA ERS, ~$1.80/lb, 2026 |
| Orange | $0.287/100g | 2 | USDA ERS, ~$1.30/lb, 2026 |
| Apple | $0.408/100g | 2 | USDA ERS, ~$1.85/lb, 2026 |
| Pork loin | $1.204/100g | 2 | Retail report, ~$5.46/lb, 2026 |
| Turkey breast | $0.728/100g | 2 | Retail report, ~$3.30/lb, 2026 |
| Bell pepper, red | $0.485/100g | 3 | National retail avg, ~$2.20/lb |
| Cucumber | $0.265/100g | 3 | National retail avg, ~$1.20/lb |
| Blueberries | $0.882/100g | 3 | National retail avg, ~$4.00/lb |
| Strawberries | $0.661/100g | 3 | National retail avg, ~$3.00/lb |
| Grapes | $0.551/100g | 3 | National retail avg, ~$2.50/lb |
| Pineapple | $0.176/100g | 3 | National retail avg, ~$0.80/lb |
| Spinach | $0.772/100g | 3 | National retail avg, ~$3.50/lb |
| Kale | $0.551/100g | 3 | National retail avg, ~$2.50/lb |
| Avocado | $0.441/100g | 3 | National retail avg, ~$2.00/lb |
| Salmon | $2.203/100g | 3 | National retail avg, ~$9.99/lb |
| Shrimp | $1.982/100g | 3 | National retail avg, ~$8.99/lb |
| Canned tuna | $1.058/100g | 3 | National retail avg, ~$4.80/lb drained-equiv. |
| White bread | $0.441/100g | 3 | National retail avg, ~$2.50/20oz loaf |
| Whole-wheat bread | $0.564/100g | 3 | National retail avg, ~$3.20/20oz loaf |
| Oats, dry | $0.143/100g | 3 | National retail avg, ~$0.65/lb |
| Almonds | $1.653/100g | 3 | National retail avg, ~$7.50/lb |
| Walnuts | $1.543/100g | 3 | National retail avg, ~$7.00/lb |
| Olive oil | $2.094/100g | 3 | National retail avg, ~$9.50/lb |
| Peanut butter | $0.661/100g | 3 | National retail avg, ~$3.00/lb |
| Pasta, dry | $0.286/100g dry | 3 | National retail avg, ~$1.30/lb dry |
| Quinoa, dry | $0.294/100g dry | 3 | National retail avg, ~$4.00/lb dry |
| Brown rice, dry | $0.309/100g dry | 3 | National retail avg, ~$1.40/lb dry |
| Firm tofu | $0.551/100g | 3 | National retail avg, ~$2.50/lb |
| Edamame, frozen | $0.661/100g | 3 | National retail avg, ~$3.00/lb |
Weekly Totals by Pattern (raw engine output)
| Pattern | kcal | Protein (g) | Carbs (g) | Fat (g) | Fiber (g) | Weekly Cost |
|---|---|---|---|---|---|---|
| Omnivore | 14,489 | 1,230.0 | 1,289.2 | 499.4 | 218.1 | $85.17 |
| Vegetarian | 14,802 | 1,180.5 | 1,313.3 | 573.9 | 292.8 | $65.41 |
| Vegan | 15,018 | 1,148.6 | 1,752.4 | 474.0 | 623.3 | $46.17 |
| Pescatarian | 14,795 | 1,203.1 | 1,381.8 | 515.6 | 293.8 | $76.91 |
| Halal | 14,566 | 1,209.2 | 1,241.7 | 545.5 | 231.7 | $74.01 |
| Mediterranean | 14,473 | 1,236.3 | 1,296.2 | 502.2 | 217.8 | $76.41 |
| Low-Carb | 14,452 | 1,348.7 | 919.0 | 611.3 | 191.5 | $97.79 |
| High-Protein | 14,916 | 1,513.6 | 1,071.7 | 509.4 | 201.3 | $103.56 |
Note: the Mediterranean pattern was the only one of the 8 that did not require the engine’s “meal distribution” constraint to be relaxed to reach a valid 7-day plan — a structural observation about the engine’s constraint-solving, not a cost finding.
The full 310-line ingredient-level breakdown (all 8 patterns, per-item grams and cost) is available in the downloadable CSV linked above.